Share this
Managed transportation is evaluated on cost predictability as much as on cost itself. When similar shipments do not land at similar costs, planning becomes unreliable and total spend becomes harder to manage.
Rates are negotiated, carriers are in place, and shipments are moving, yet outcomes vary. Some loads follow contracts, others move on the spot market, and additional charges appear during execution.
Managed transportation pricing is shaped by how those decisions are made. When they follow a consistent structure, cost becomes predictable across similar shipments and deviations are easier to isolate. That is what makes savings measurable.
Understanding Managed Transportation ROI
Similar shipments diverge in cost when planning, carrier selection, and execution conditions are not consistent. A consistent decision structure reduces that spread. Carrier selection, routing, execution, and invoice validation all reference the same baseline defined at booking.
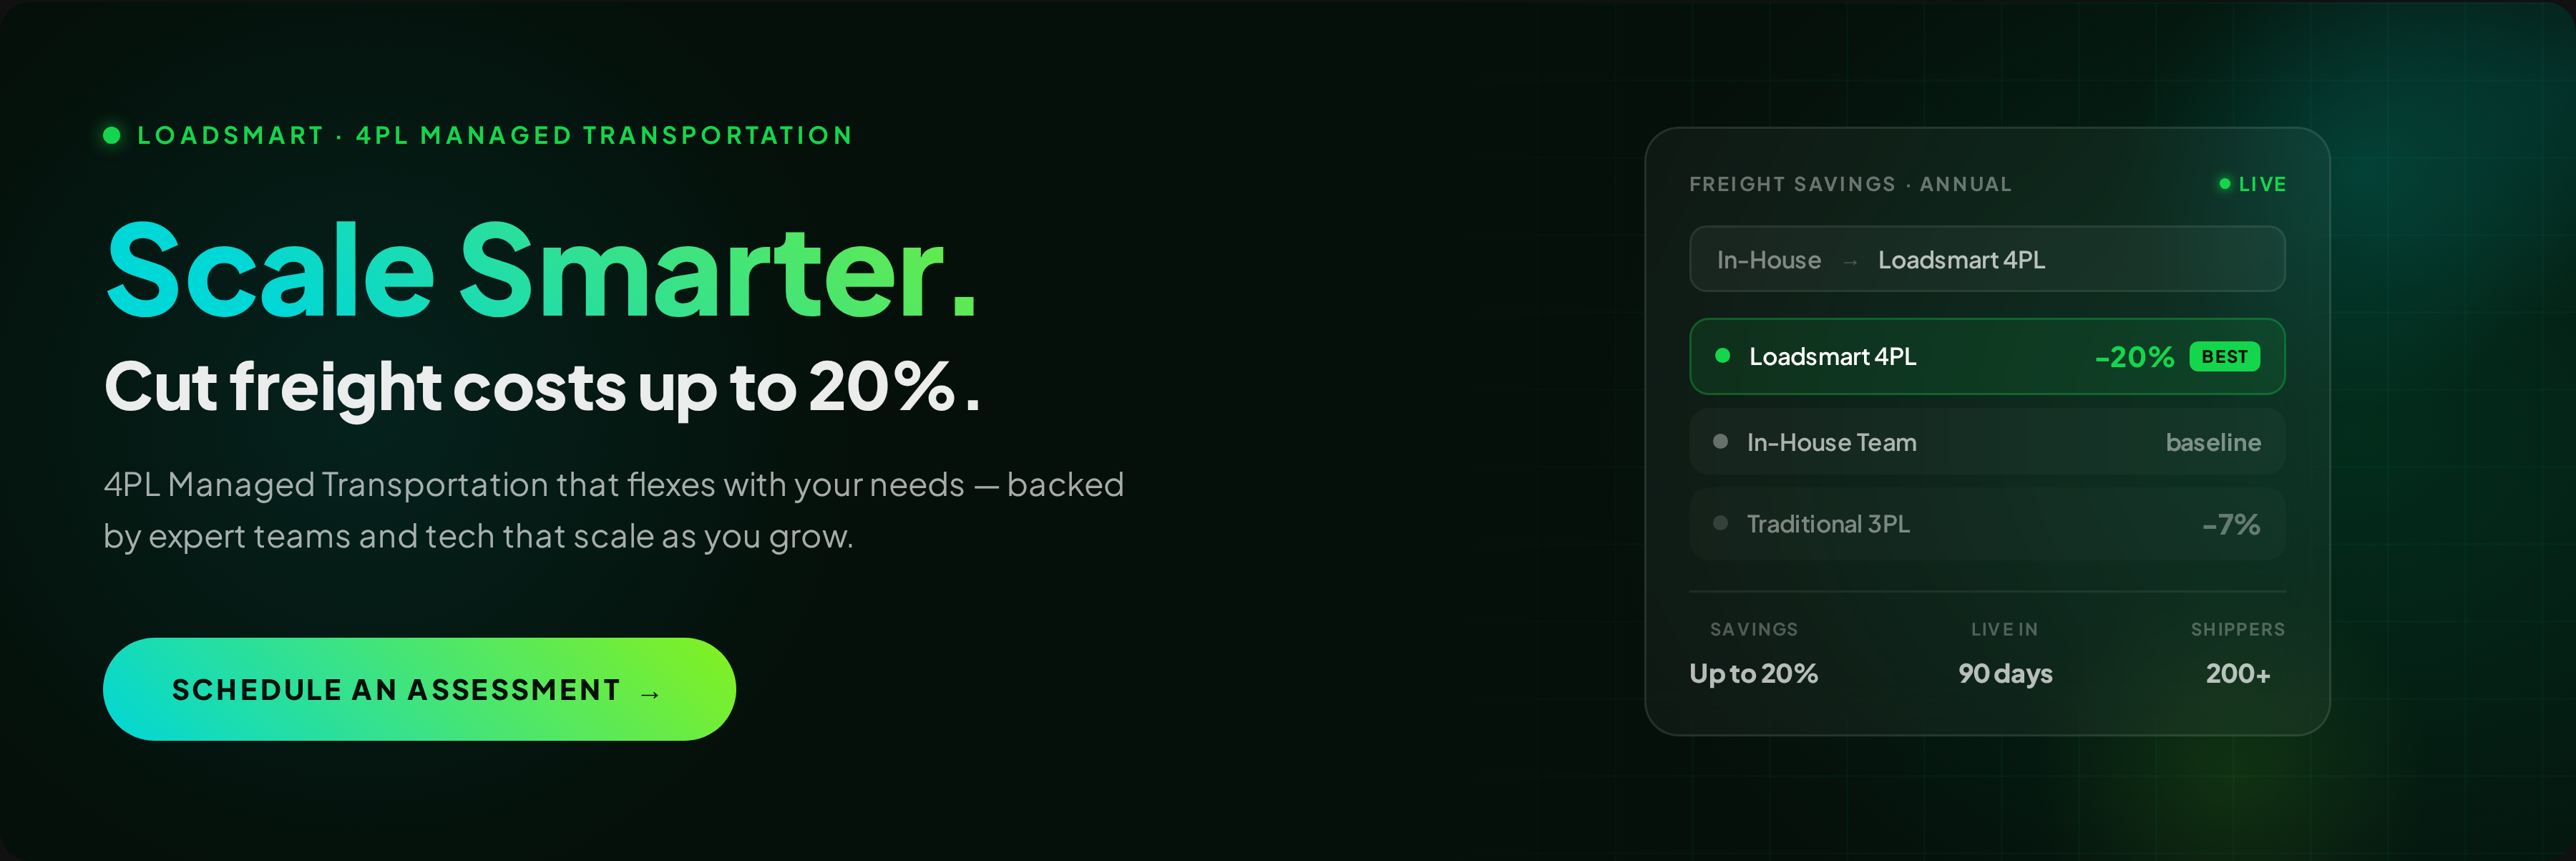
The payback from this shift usually appears within 6 to 12 months. Early gains come from tighter procurement discipline and reduced rate dispersion across similar lanes. As more volume moves through the same process, consolidation increases and invoice variance declines.
Category 1: Carrier Rate Reductions (3–10%)
The same lane often moves at different price points depending on when and how it is sourced.
A lane that should consistently move on contract ends up split between contract and spot because loads are planned at different times or evaluated against different criteria. Some shipments are booked early against contracted capacity. Others are sourced late and default to spot.
- Volume Leverage: Aggregated demand allows carriers to price against predictable volume instead of isolated loads
- Market Intelligence: Carrier selection reflects current lane conditions instead of relying on internal history
Category 2: Optimization Savings (15–40%)
Shipments that move through the same lanes are often planned and executed independently.
Orders are created and dispatched without considering other loads moving in parallel, which prevents consolidation and limits routing options. Capacity is underutilized and higher-cost modes are used by default.
- Load Consolidation: Shipments with overlapping routes or timing are grouped to reduce the total number of moves
- Mode and Route Optimization: Loads are assigned to the appropriate mode based on service requirements
Category 3: Freight Audit Savings (5%+)
Invoices reflect all events associated with a shipment, including additional charges that arise during execution.
When these charges are reviewed without context, issues are resolved case by case and tend to repeat across similar shipments. The same reweigh, reclassification, or accessorial appears again because the underlying condition was not corrected at booking.
- Billing Errors: Differences between expected and invoiced amounts are identified
- Accessorial Reduction: Charges are validated against actual shipment conditions and contract terms
- Compliance: Carrier agreements are applied consistently across shipments
Category 4: Headcount and Technology Savings
Manual coordination across carrier communication, tracking, scheduling, and invoice reconciliation drives headcount growth.
Teams follow up on shipment status, confirm appointments, resolve exceptions, and reconcile charges across multiple systems. As shipment volume increases, additional resources are added to maintain service levels.
- 75%+ Headcount Reduction or Reallocation: Routine coordination and follow-up tasks are automated
- TMS License Fees: Consolidating tools reduces overlapping functionality and vendor costs
- Maintenance Costs: Fewer systems and integrations reduce ongoing operational effort
In many managed transportation agreements, these gains are tied to defined automation targets, where reductions in manual intervention and headcount are measured explicitly.
Category 5: Accessorial Charge Reduction (50%+)
Delays at facilities, incomplete shipment data, and misaligned scheduling drive recurring accessorial charges.
When these conditions are not addressed at planning, the same fees repeat across shipments.
- Detention: Scheduling and visibility reduce wait time at pickup and delivery, avoiding charges driven by early arrivals, congestion, or missed appointment windows
- Fuel Surcharge: Pricing is applied consistently across carriers, reducing variability caused by different surcharge structures or outdated rate assumptions
- Fee Optimization: Accurate shipment details at booking reduce avoidable charges such as reclassification, reweighs, and incorrect accessorial application
Category 6: Invoice Auto-Approval Savings
Finance teams manually review invoices to verify rates and charges, which scales linearly with shipment volume and creates a bottleneck. Each invoice is checked against rate confirmations and shipment details, often line by line.
- Touchless Processing: Invoices that align with expected cost are approved automatically
- AP Labor Reduction: Teams focus on exceptions instead of reviewing every invoice
- Error Detection at Scale: Discrepancies are flagged consistently across shipments
The Typical Mid-Market ROI Profile
Savings vary based on shipment volume, network complexity, and the current level of process consistency. A transportation savings assessment benchmarks current performance and identifies where those gaps exist.
The ranges below reflect illustrative outcomes based on typical mid-market networks.
|
Savings Category |
$10M Shipper |
$25M Shipper |
$50M Shipper |
|
Carrier Rate Reductions |
$300K–$1M |
$750K–$2.5M |
$1.5M–$5M |
|
Optimization Savings |
$1.5M–$4M |
$3.75M–$10M |
$7.5M–$20M |
|
Freight Audit Savings |
$500K+ |
$1.25M+ |
$2.5M+ |
|
Headcount & Technology |
$250K–$600K |
$500K–$1.5M |
$1M–$3M |
|
Accessorial Reduction |
High variability |
High variability |
High variability |
|
Invoice Auto-Approval |
Embedded efficiency gains |
Embedded efficiency gains |
Embedded efficiency gains |
Frequently Asked Questions About Managed Transportation ROI
If you are still evaluating the cost impact, the questions below address the most common points.
What Is the Average ROI of Managed Transportation?
Most mid-market operations see savings across multiple categories, with 3-10% in carrier rate reductions, 10-40% in optimization savings, and 5%+ in audit-driven freight recovery, depending on where cost is being created. Operations relying on spot see immediate gains in procurement. Networks running fragmented LTL shipments capture more through consolidation. High accessorial spend or frequent invoice discrepancies indicate additional savings in execution and audit.
How Soon Will I See Savings After Implementation?
Carrier selection improves first, reducing rate dispersion across similar lanes. Planning follows with more consistent consolidation and routing decisions. Automation and headcount impact follow as workflows are centralized. Most operations see measurable impact within the first few months, with full payback typically within 6 to 12 months.
What Factors Most Impact Managed Transportation ROI?
Three factors define the outcome: when decisions are made, how consistently they are applied, and how much of the operation follows the same process. Late planning increases reliance on spot. Inconsistent carrier selection creates pricing spread across similar lanes.
Repeated execution and billing issues point to gaps upstream. These gaps are identified through a transportation assessment that benchmarks current performance and isolates where variation is introduced.
Are the Savings Guaranteed in the Contract?
It depends on how savings are defined and measured in the agreement. Procurement and optimization gains are typically measured against a defined baseline. Areas like accessorial reduction and headcount impact depend on operational changes and adoption. Loadsmart's managed transportation agreements include clearly defined KPIs and reporting, with continuous improvement targets written into the contract.
See Your Savings Potential With a Free Assessment
If you are still evaluating where cost is coming from, the next step is to look at how shipments are planned, sourced, and executed across the network.
Freight cost is set by those decisions. When they follow different criteria, similar shipments produce different outcomes and cost diverges across the network.
That divergence creates a gap between expected and actual spend. ROI depends on how much of that gap can be removed. A transportation assessment evaluates those decisions directly. It benchmarks current performance, identifies where variation is introduced, and quantifies how that translates into cost.
Closing that gap requires applying the same decision structure across planning, carrier selection, execution, and validation. This is how savings potential is identified and captured.